DIGITAL ELECTRONIC
Distributed tracing is a method used to trace messages flowing through your business applications built using various Azure services, where they are well-suited for tracking and identifying any unexpected performance failures.
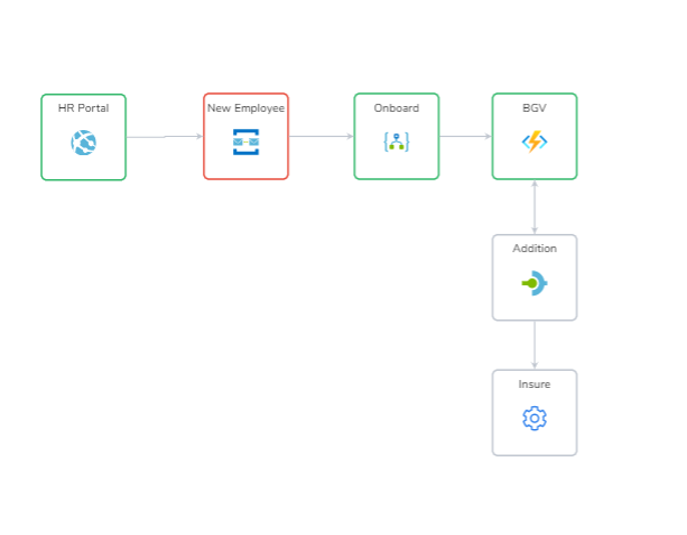
For instance, consider an employee onboarding application that involves multiple Azure services and on-premises components. Then, it might be challenging to trace and get complete visibility of data transferred between those services. That is where exactly distributed tracing can help you!
Hence, this blog aims to provide you with an ultimate solution that can meet all your logging and tracing needs, especially for cloud-native and hybrid applications involving Microsoft Azure.
Why Distributed Tracing for Azure and Hybrid Applications?
Distributed tracing is one best way to achieve ‘real-time’ visualization of how the message flows within your system, helping your Azure operations team better analyze your business process’s performance.
In all business sectors, including finance, healthcare, logistics, retail, telecommunications, and more, end-to-end tracing is widely used to address visibility challenges. Similarly, tracking is necessary for Azure and hybrid solutions to quickly understand the message flow, maximize visibility, pinpoint bottlenecks, eventually reduce the overall application downtime.
But wait, if you are relatively new to phrases like business processes and transactions, then it is better to understand them since they will be constantly used as we dig deeper into the topic.
The business process represents your entire application workflow and will have a group of business transactions that are nothing but a set of activities within a workflow.
Significant Benefits of End-to-end Distributed Tracing
- You will be able to get a unified view of your message workflow
- Intuitive dashboards to visualize the correlation between messages
- Monitor the performance of your business processes in real-time
- Track every stage in your business flow
- Resolve business failures before they affect the end-customer
- Reduce or eliminate the need for manually generating historically based reports
Do Organizations Still Build End-to-end Logging and Tracking Custom Tools?
Application Insights of Azure Monitors does offer a feature called Application Map, which helps you understand the relationship between the distributed Azure Services. Still then, it would be challenging to visualize how your message flows through those services.
When connected with Log Analytics, it is even possible to log the monitored data, but everything is more for individual Azure services and not for an entire application.
That is why organizations generally build their logging and end-to-end tracing tools for Azure-focused solutions.
But the actual problem is it involves too many manual tasks, requiring an additional workforce, which forces even the Azure developers to write code to develop custom tracking tools instead of letting them focus on developing business applications. That is how third-party monitoring tools became inevitable to avoid the complexities of building custom tools.
There are many options available in the market, and each has its benefits. We will exclusively focus on Serverless360 BAM and how it stands out from the rest.
Serverless360 – A Comprehensive End-to-end Tracking Solution
Serverless360 BAM allows the business users to track, visualize and identify failures in the message flow across the distributed Azure services. Here is an outline of how you can set up tracking in Serverless360 for your applications involving different Azure services.
- Configure Azure SQL Database and Blob Storage to store the tracked data and the message details.
- The next step is defining the business processes to visualize their flow and configure the stages in each business transaction to capture the necessary properties.
- Then, instrument your business process for message tracking. You can leverage the custom connectors if you have Logic apps involved in your integration. If there are other services like Custom Apps, Function Apps, APIM, you can track the messages using the .Net library and SDKs from Serverless360.
Serverless360 is all set for tracking your business applications with these quick steps. You can check out their documentation to clarify the above process.
Key Features of Serverless360’s Business Activity Monitoring (BAM)
Visualize Message Flow
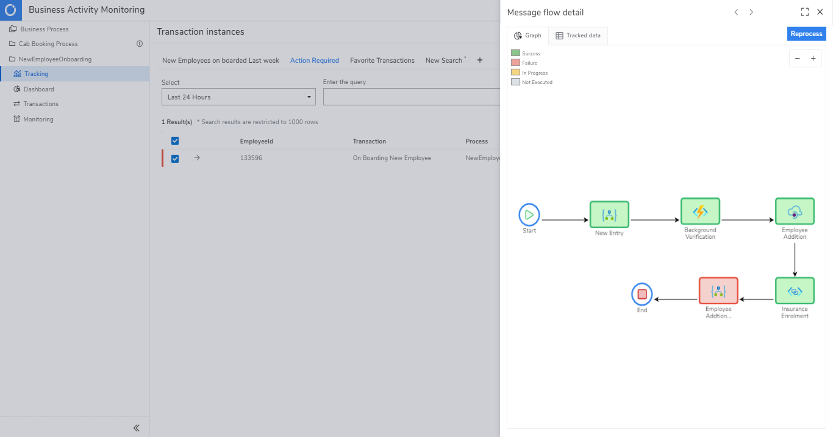
Serverless360’s BAM visually represents your business workflows, making it easier to correlate the messages flowing through various Azure services of your complex integrations.
In addition to that, each stage in your message flow will be depicted in different colors indicating their status (success, failure, In-progress, Reprocessed, etc.), so you will spot the failures at a glance.
Repair and Reprocess Failed Transactions
Each transaction in your business workflow will be tracked, which helps to identify the root cause and resolve the transaction failures at ease. But, among the many transactions involved, it might be hard to spotlight the failed ones alone. Under such circumstances, Serverless360 brings the faulty transactions in a separate tab, “Action required.”
This way, you can easily segregate the failed transactions, modify the necessary value and reprocess them for a successful resubmission.
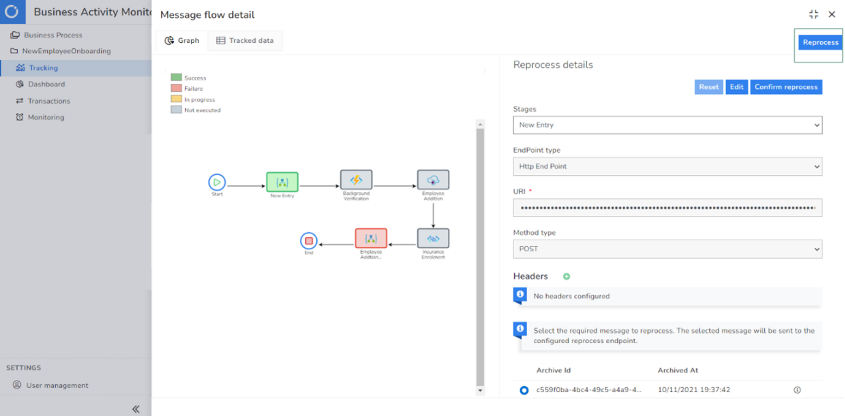
The platform further supports Bulk reprocessing and Dynamic reprocessing.
Query Search
Serverless360’s BAM lets you fetch business-critical data from many transactions using simple queries, which you can then save, and re-use whenever needed.

Out-of-the-box Monitoring Support
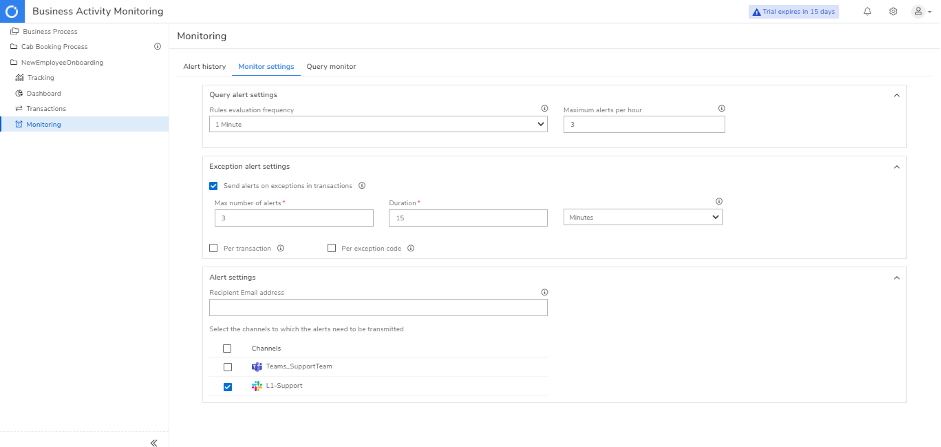
Monitor your business processes on various aspects and instantly alert via different notification channels by setting up maximum thresholds. There are two primary monitoring types offered by Serverless360 BAM – Exception Monitoring and Query Monitoring.
Exception Monitoring: Any exceptions occurring within a specified period will trigger an alert. For example, if there are any exceptions within the last 20 minutes, you will be notified.
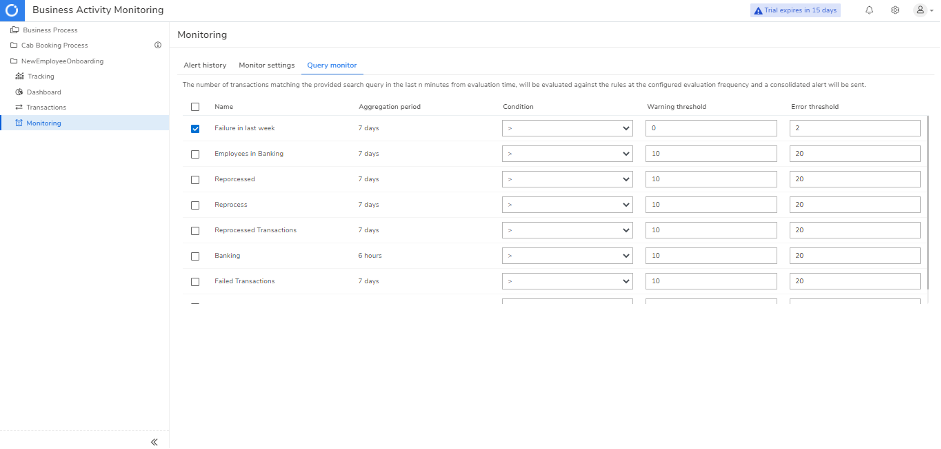
Query Monitoring: This keeps you informed about the performance of your business processes by monitoring them based on different queries. For example, you can choose to get either a warning or an error alert when failures detected within a specific time duration reaches the threshold limit.
There is also an alert history tab, which lists all the alerts generated by Query and Exception Monitoring so that you can view all the alert details and figure out the failed ones.
Dashboard
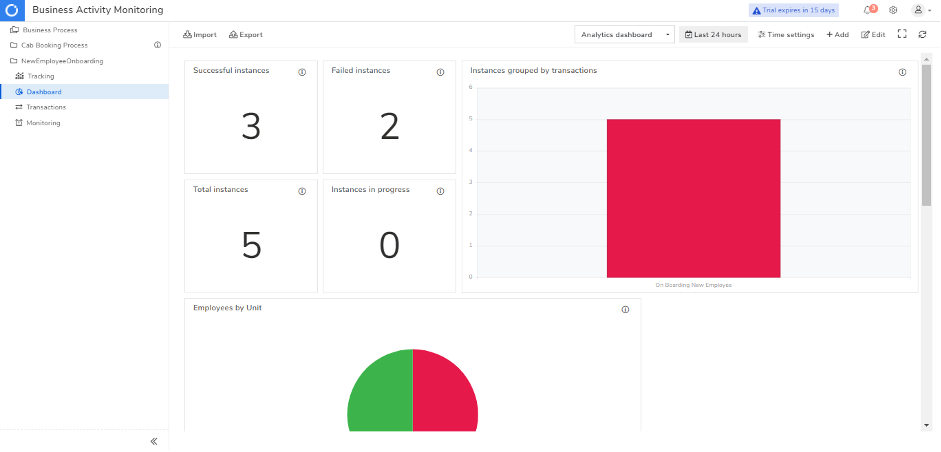
You can view and analyze the tracked data using Serverless360 BAM’s real-time dashboard, which gives you a visual representation of the data in charts and reports. You can quickly detect anomalies and visualize data trends that can help take appropriate corrective measures.
Below is an example of Serverless360’s BAM dashboard, allowing you to instantly see when there is a spike in failed transactions to find out what the problem is and fix it.
Conclusion
As mentioned above, in a real-time business scenario, any Azure or hybrid application will incorporate several services, making it difficult to visualize the flow of messages. In this blog, we discussed how Serverless360 BAM (15-day free trial) could be used to achieve end-to-end visibility, visualize message flow, monitor business processes, detect failures, perform root cause analysis – all in a single platform. Further explained how distributed tracing can be helpful and why using third-party BAM tools can be more effective than building custom tracking tools.
The post Serverless360 – Ultimate Solution for All Custom Logging and Tracking Needs appeared first on The Crazy Programmer.
from The Crazy Programmer https://ift.tt/OeJ9uFi
